Total Revenue of $29.6 million Up 2.4% YoY, 348% YoY Increase in illumin Self-Serve Revenue
(All monetary figures are expressed in thousands of Canadian dollars unless otherwise stated)
illumin Holdings Inc. (TSX: ILLM) (“illumin” or the “Company”), a journey advertising technology company that empowers marketers to make smarter decisions about communicating with online consumers, today announced its financial results for the third quarter ended September 30, 2023.
Third Quarter 2023 Highlights
- Third quarter 2023 revenue was $29.6 million up 2.4% year-over-year, reflecting growth in our self-serve business.
- illumin self-serve revenue was up 348% to $5.1 million, compared to $1.2 million in the year ago period and represented 17% of total revenue, up from 16% in Q2 2023. Self-serve growth was driven by an increase in new customers and platform utilization.
- The Company onboarded 33 net new self-serve clients during the quarter, reflecting sales initiatives targeting higher-spend clients and positioning the Company for continued illumin self-serve revenue growth in Q4 2023.
- Third quarter 2023 gross margin was 47%, compared to 51% for the same period in 2022, reflecting changes in both geographic mix and an increasing proportion of self-service revenue.
- Net revenue or gross profit (revenue less media costs) for the three months ended September 30, 2023 was $13.9 million, compared with $14.8 million in the same quarter in the prior year.
- Adjusted EBITDA was $0.2 million for the third quarter, compared to $1.6 million in the prior year period, primarily due to ongoing strategic investments in R&D, sales and marketing to support our growth as well as lower margin revenue outside of North America.
- Q3 2023 net income was $0.8 million, compared to net income of $3.2 million in Q3 2022, the decrease was primarily a result of lower Adjusted EBITDA and foreign exchange impact due to a weakened US dollar compared to the prior year period.
- At September 30, 2023, the Company had cash and cash equivalents of $60 million, compared to $86 million as of December 31, 2022. This decrease was attributable to positive cash flow from operations ($1.3 million), which was more than offset by a combination of share repurchases ($14.6 million), net loan repayments ($4.4 million), lease payments ($2.4 million), and strategic investments in our business ($5.5 million).
- At the conclusion of the previously announced substantial issuer bid (“SIB”) on August 31, 2023, the Company repurchased 4.6 million of its outstanding common shares at a purchase price of $2.65 per share for an aggregate purchase price of approximately $12.2 million.
- On September 11, we voluntarily delisted and ceased trading on the Nasdaq Capital Market. illumin’s shares continue to be listed on the Toronto Stock Exchange under the trading symbol “ILLM”.
- On October 26, the Company announced the planned transition of its Chief Executive Officer, Tal Hayek. Once a new CEO is appointed, Mr. Hayek will transition from his current CEO role to that of Non-Executive Vice Chairman on the Board of Directors of illumin.
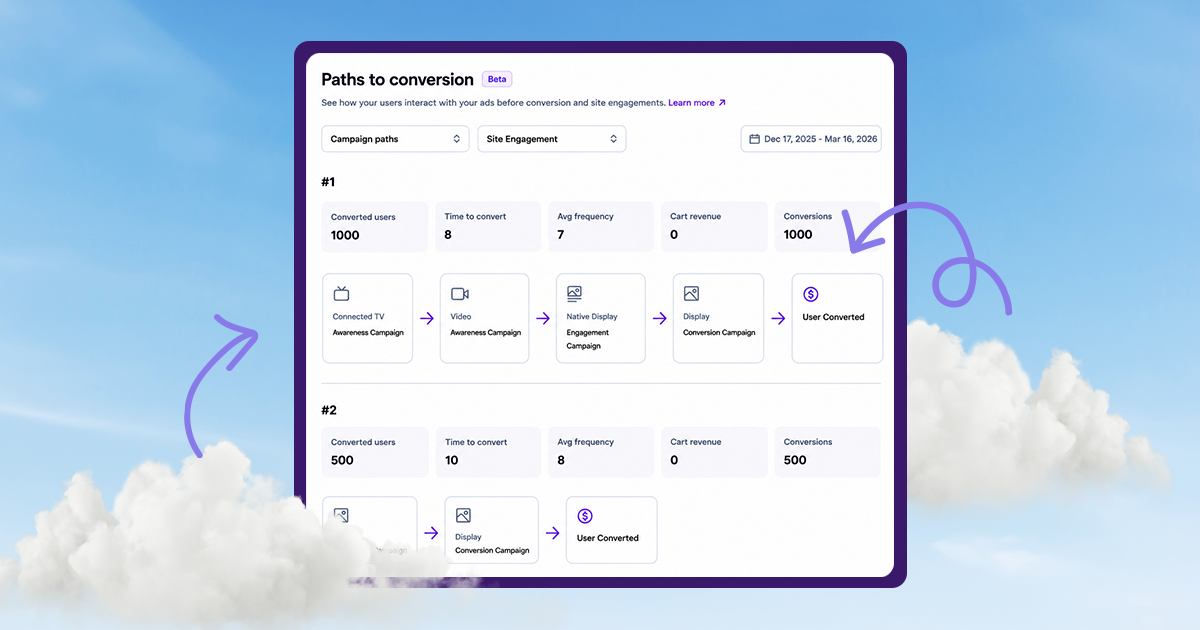
Tal Hayek, Co-Founder and Chief Executive Officer of illumin, stated, “During the third quarter, we generated substantial year-over-year growth in illumin self-serve revenue. We also continued to enhance the illumin brand by establishing a fully integrated connection with Meta to provide new Facebook and Instagram capabilities, allowing end-to-end Social Advertising, and thereby providing marketers with additional connected journey advertising intelligence.”
Mr. Hayek added, “We are encouraged by the year-over-year growth generated by our illumin self-serve offering and together with very positive and ongoing customer feedback, we will look to refine our sales efforts and identify additional strategic opportunities within the marketplace for this offering. We have also bolstered our efforts aimed at signing long-term self-serve contracts, including guaranteed revenue minimums with terms greater than one year”.
“Finally, regarding my intention to transition my role as a co-founder of illumin – I’m extremely proud of what we have accomplished together with this incredibly talented team. We have brought a revolutionary illumin journey advertising platform to life. I am committed to working closely with the Board and my eventual successor for a smooth transition and to ensure we take the Company to the next level,” concluded Mr. Hayek.
Elliot Muchnik, illumin’s Chief Financial Officer, commented, “In addition to sales growth, we achieved positive Adjusted EBITDA in the quarter despite a challenging macroeconomic environment. Moreover, our planned normal course issuer bid (“NCIB”), following the completion of our SIB, shows our unwavering belief in illumin’s potential.
In addition, the Company generated positive cash from operations of $1.3 million for the nine months ended, an improvement of $2.5 million from the prior year. This further bolsters our exceptionally strong balance sheet and allows us to continue investing in illumin’s future and to build upon our market-leading status.”
The following table presents a reconciliation of net income (loss) to Adjusted EBITDA for the periods ended:
| Three months ended | Nine months ended | |||
| September 30, | September 30, | September 30, | September 30, | |
| 2023
|
2022
(As restated) |
2023
|
2022
(As restated) |
|
| Net income (loss) for the period | $ 762 | $ 3,153 | $ (8,409) | $ 66 |
| Adjustments: | ||||
| Finance costs (income) | (612) | 158 | (1,594) | 430 |
| Foreign exchange loss (gain) | (1,666) | (5,836) | 793 | (7,228) |
| Depreciation and amortization | 1,433 | 1,125 | 4,372 | 3,527 |
| Income tax expense (benefit) | (1,413) | 1,379 | (1,177) | 1,432 |
| Share-based compensation | 1,571 | 1,544 | 4,584 | 4,606 |
| Severance expenses | 119 | 116 | 367 | 398 |
| Other expenses | – | – | – | 79 |
| Total adjustments | (568) | (1,514) | 7,345 | 3,244 |
| Adjusted EBITDA | $ 194 | $ 1,639 | $ (1,064) | $ 3,310 |
Conference Call Details:
Date: Thursday, November 9, 2023
Time: 8:30AM Eastern Time
To register for the conference call webcast and presentation, please visit
https://illumin.com/investor-information/earnings-call/
Please connect 15 minutes prior to the conference call to ensure time for any software download that may be needed to hear the webcast.
A recording of the conference call webcast will be available after the call by visiting the Company’s website at https://illumin.com/investor-information/
Non-IFRS Measures
This press release makes reference to certain non-IFRS measures. These measures are not recognized measures under IFRS, do not have a standardized meaning prescribed by IFRS, and are therefore unlikely to be comparable to similar measures presented by other companies. Rather, these measures are provided as additional information to complement those IFRS measures by providing further understanding of our results of operations from management’s perspective. Accordingly, these measures should not be considered in isolation nor as a substitute for analysis of our financial information reported under IFRS. We use non-IFRS measures including “revenue less media costs”, “revenue less media costs margin”, “Adjusted EBITDA” and “Adjusted Net Income (Loss)” (as well as other measures discussed elsewhere in this press release).
The term “revenue less media costs margin” refers to the amount that “revenue less media costs” represents as a percentage of total revenue for a given period, while the term “revenue less media costs” refers to the net amount of revenue after deducting direct media costs. Revenue less media costs is used for internal management purposes as an indicator of the performance of the Company’s solution in balancing the goals of delivering excellent results to advertisers while meeting the Company’s margin objectives and, accordingly, the Company believes it is useful supplemental information.
“Adjusted EBITDA” refers to net income (loss) after adjusting for finance costs (income), impairment loss, fair value gain, income taxes, foreign exchange loss (gain), depreciation and amortization, share-based compensation, acquisition and related integration costs, severance expenses and adjustments to the carrying value of investment tax credits receivable. The Company believes that Adjusted EBITDA is useful supplemental information as it provides an indication of the results generated by the Company’s main business activities before taking into consideration how those activities are financed and taxed and prior to taking into consideration depreciation of property and equipment and certain other items listed above. It is a key measure used by the Company’s management and board of directors to understand and evaluate the Company’s operating performance, to prepare annual budgets and to help develop operating plans.
“Adjusted Net Income (Loss)” refers to net income (loss) after adjusting for non-cash items such as impairment loss, fair value gain, depreciation and amortization, share-based compensation, and foreign exchange loss (gain). The Company believes that Adjusted Net Income (Loss) is useful supplemental information as it provides an indication of the results generated by the Company’s main business activities on a cash basis. It is another key measure used by the Company’s management and board of directors to understand and evaluate the Company’s operating performance, to prepare annual budgets and to help develop operating plans.
These non-IFRS measures are used to provide investors with supplemental measures of our operating performance and thus highlight trends in our business that may not otherwise be apparent when relying solely on IFRS measures. We believe that securities analysts, investors, and other interested parties frequently use non-IFRS measures in the evaluation of issuers, and that these non-IFRS measures are relevant to their analysis of the Company.
About illumin:
illumin is a journey advertising platform that enables marketers to reach consumers at every stage of their journey by leveraging advanced machine learning algorithms and real-time data analytics. The company’s mission is to illuminate the path for brands to connect with their customers through the power of data-driven advertising. Headquartered in Toronto, Canada, illumin serves clients across North America, Latin America, and Europe.
Disclaimer with regard to forward looking statements
Certain statements included herein constitute “forward-looking statements” within the meaning of applicable securities laws. These statements may relate to the Company’s future financial outlook, financial position, anticipated events, results, success of its work from home policies, the Company’s strategy with respect to the illumin platform. Forward-looking statements are necessarily based upon a number of estimates and assumptions that, while considered reasonable by management at this time, are inherently subject to significant business, economic and competitive uncertainties and contingencies. Many factors could cause the Company’s actual results, level of activity, performance or achievements or future events or developments to differ materially from those expressed or implied by the forward-looking statements, including, without limitation, the factors discussed in the “Risk Factors” section of the Company’s Annual Information Form dated March 9, 2023 for the fiscal year ended December 31, 2022 (the “AIF”) and the Company’s Management Discussion and Analysis for the three and nine months ended September 30, 2023 dated November 9, 2023 (the “MD&A”). A copy of the AIF, MD&A and the Company’s other publicly filed documents can be accessed under the Company’s profile on the System for Electronic Data Analysis and Retrieval + (“SEDAR+”) at www.sedarplus.ca and on the Electronic Data Gathering, Analysis, and Retrieval system (“EDGAR”) at www.sec.gov. The Company cautions that the list of risk factors and uncertainties described in the AIF and the MD&A are not exhaustive and other factors could also adversely affect its results. Readers are urged to consider the risks, uncertainties, and assumptions carefully in evaluating the forward-looking statements and are cautioned not to place undue reliance on such information.
Except as required by law, illumin does not intend, and undertakes no obligation, to update any forward-looking statement to reflect, in particular, new information or future events.
For further information, please contact:
| Steve Hosein
Investor Relations Coordinator illumin Holdings Inc. 416-918-5647 |
Babak Pedram
Investor Relations – Canada Virtus Advisory Group Inc. 416-646-6779 |
David Hanover
Investor Relations – U.S. KCSA Strategic Communications 212-896-1220 |
Please note that the following financial information is an extract from the Company’s Condensed Interim
Consolidated Financial Statements (unaudited) for the three and nine months ended September 30, 2023 and 2022
(the “Financial Statements”) provided for readers’ convenience and should be viewed in conjunction with the Notes to the Financial Statements, which are an integral part of the statements. The full Financial Statements and MD&A for the period may be found by accessing SEDAR+ and EDGAR.
| September 30,
2023 |
December 31,
2022 |
Assets | Current assets | Cash and cash equivalents | $ 59,823 | $ 85,941 | Accounts receivable | 28,261 | 33,792 | Income tax receivable | 2,405 | 848 | Prepaid expenses and other | 5,947 | 3,153 | 96,436 | 123,734 | Non-current assets | Deferred tax asset | 449 | 449 | Other assets | 275 | 248 | Property and equipment | 9,171 | 7,117 | Intangible assets | 8,186 | 5,229 | Goodwill | 4,870 | 4,870 | 119,387 | 141,647 | Liabilities | Current liabilities | Accounts payable and accrued liabilities | 24,873 | 26,545 | Income tax payable | 215 | 43 | Borrowings | 344 | 4,032 | Lease obligations | 2,343 | 2,882 | 27,775 | 33,502 | Non-current liabilities | Borrowings | 79 | 191 | Deferred tax liability | 1,035 | 1,060 | Lease obligations | 6,561 | 3,768 | 35,450 | 38,521 | Shareholders’ equity | 83,937 | 103,126 | 119,387 | 141,647 |
| Three months ended | Nine months ended | 2023 | 2022
(As restated) |
2023 | 2022
(As restated) |
Revenue | Managed services | $ 17,268 | $ 20,425 | $ 54,344 | $ 54,338 | Self-service | 12,360 | 8,523 | 34,969 | 26,691 | 29,628 | 28,948 | 89,313 | 81,029 | Media costs | 15,739 | 14,103 | 47,066 | 39,601 | Gross profit | 13,889 | 14,845 | 42,247 | 41,428 | Operating expenses | Sales and marketing | 6,336 | 5,904 | 19,023 | 16,746 | Technology | 4,471 | 4,244 | 14,937 | 11,765 | General and administrative | 3,007 | 3,174 | 9,718 | 10,084 | Share-based compensation | 1,571 | 1,544 | 4,584 | 4,606 | Depreciation and amortization | 1,433 | 1,125 | 4,372 | 3,527 | 16,818 | 15,991 | 52,634 | 46,728 | Loss from operations | (2,929) | (1,146) | (10,387) | (5,300) | Finance costs (income) | (612) | 158 | (1,594) | 430 | Foreign exchange loss (gain) | (1,666) | (5,836) | 793 | (7,228) | (2,278) | (5,678) | (801) | (6,798) | Net income (loss) before income taxes | (651) | 4,532 | (9,586) | 1,498 | Income tax expense (benefit) | (1,413) | 1,379 | (1,177) | 1,432 | Net income (loss) for the period | 762 | 3,153 | (8,409) | 66 | Basic and diluted net income (loss) per share | 0.01 | 0.05 | (0.15) | 0.00 | Other Comprehensive Income (Loss) | Items that may be subsequently reclassified to net income (loss): | Exchange gain (loss) on translating foreign ops | (681) | (224) | (734) | 10 | Comprehensive income (loss) for the period | 81 | 2,929 | (9,143) | 76 | |||||||||||||||||||||||||||||||||||||||||||||||||||||||||||||||||||||||||||||||||||||||||||||
| 2023 | 2022
(As restated) |
Cash provided by (used in) | Operating activities | Net income (loss) for the period | $ (8,409) | $ 66 | Adjustments to reconcile net loss to net cash flows | Depreciation and amortization | 4,372 | 3,527 | Finance costs (income) | (1,594) | 430 | Share-based compensation | 4,584 | 4,606 | Foreign exchange loss (gain) | 793 | (7,228) | Income tax benefit | (1,177) | – | Change in non-cash operating working capital | Accounts receivable | 4,564 | 2,637 | Prepaid expenses and other | (2,086) | 106 | Other assets | (25) | (361) | Accounts payable and accrued liabilities | (1,813) | (4,296) | Income tax payable | – | (351) | Income taxes received | 133 | – | Interest received (paid), net | 1,965 | (328) | 1,307 | (1,192) | Investing activities | Additions to property and equipment | (443) | (162) | Additions to intangible assets | (5,072) | (2,650) | (5,515) | (2,812) | Financing activities | Repayment of term loans | (4,411) | (1,680) | Proceeds from international loans | 638 | 1,136 | Repayment of international loans | (647) | (1,407) | Repayment of leases | (2,411) | (1,535) | Repurchase of common shares for cancellation | (14,637) | (13,000) | Proceeds from the exercise of stock options | 7 | 374 | (21,461) | (16,112) | Decrease in cash and cash equivalents | (25,669) | (20,116) | Impact of foreign exchange on cash and cash equivalents | (449) | 6,141 | Cash and cash equivalents – beginning of period | 85,941 | 102,209 | Cash and cash equivalents – end of period | 59,823 | 88,234 | Supplemental disclosure of non-cash transactions | Additions to property and equipment under leases | 4,710 | 3,809 |